Design a Template in the Document Template Editor
When you design a template, you can:
Add an Image
You can use images in your report template.
|
The Document Template Editor supports these image formats:
|
-
Click and drag the desired image in Image panel onto the Report Canvas (either in the header, body, or footer areas).
You can also drag the desired image to a Layout Table cell.. Position the image element anywhere.
Use the
 to reposition the image anywhere on the Report Canvas.
Only a single image can be added in an image placeholder element.
-
If the image isn’t shown in the panel,
-
Click
 to open the default location for your images.
 -
Navigate to the image location.
-
Click Open.
A thumbnail of the image appears in the Image panel. -
Click and drag that image to the Report Canvas.
-
-
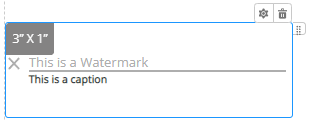
To change the image size, click on the pencil icon.
-
At the Edit Image window, use the up and down buttons for either Width(inches) or Height(inches).
Changing one dimension automatically changes the other to keep the image proportional. -
Click Save.
-
-
To remove the image, click
 icon in the corner of the image.
Add Text
You can add text to any section of the Report Canvas by clicking where you want the text to appear. While in a text element, you can format the text and change:
-
Font name
-
Font Size
-
Bold, Italic, Underline
-
Left, Center, Right Alignment

The functionality is like working in a document editor like Microsoft Word.
-
Start typing in the canvas.
-
To change the font, font size, apply formatting, or alignment, highlight the text first and then apply them.
Insert a Data Element
Use the </> Insert button to insert a data element into the template.
Depending on what you had selected as the base object for the template, the available fields for use will be different.
The Editor has organized each field into categories.
For more information on objects in FieldFX, see Field FX objects.
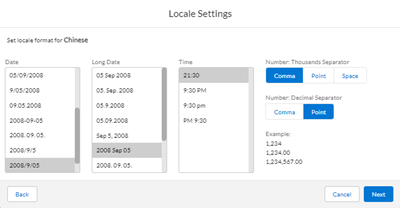
Set a Language for Automatic Report Translation
The Document Template Editor supports these languages:
|
|
|
The preview shows the template in selected language. You can add multiple languages to the template.
| This is a shared component between FieldFX back office and FX mobile so they both use the same character library. |
Add and Configure a Repeating Section
This element allows you to add child objects and set the following:
-
Add a child relationship to the parent object
-
Add related fields
-
Add a layout table in the section and customize/format the table
-
Add images, signatures, and an additional or more repeating section.
See Configuring Repeating Sections for more information.
-
Drag the Repeating Sections element to the Report Canvas.
-
At the Select Relationship modal, click in the Relationship search field and enter the name of a relationship.
Complete the same steps as in Filter a Data Table.
-
You can also Skip this step.
Add and Configure a Data Table
After you have added a data table to the report canvas, you can configure the table to suit the data.
-
Drag the Data Table element to the Report Canvas.
A 1 column by 2 rows table appears.
You can have more than one Data Table in a report. For example. you can have multiple ticket item data tables on a report, each filtered by a different record type (equipment, labor, among others.) -
At the Select Relationship panel that appears, click in the Relationship drop-down and select only objects having a look up or master-to-detail relationship to the report template’s object.
Depending on the template you created and linked to a FieldFX object, the available for use. -
Enter in the Table Header Name (Optional) a name for the table.
-
Use the steps in Filter a Data Table to set up a Data Table filter.
A filter can be useful if you want to have different views of child records that show in a Data Table. -
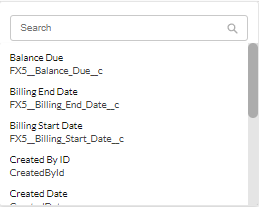
In the Data Table, click Select Field to define the first field of the table.
These are all the SObject fields available where the report template editor can pull data. -
At the Insert SObject Field popup, choose the SObject the same as you would in Insert References.
Or you can select "No Field" and have nothing appear in the cell.Once you select the field, a suggested header appears based on the field you selected. You can change the header by clicking on it and entering new text. The column header changes to the name of the SObject field you chose.
-
To add more columns, click
 from the toolbar.
 -
You can drag the data table to other areas of the report.
-
You can add text or insert another field in the same cell as the first field.
-
You can only add another column and not another row.
-
-
Repeat these steps to define more fields and rows.
|
Filter a Data Table
You can filter a data table to show only certain child records for the root report template root object. Additionally, you can add conditions to the filter so records only appear if they meet certain defined conditions. In a filter, you can group conditions together so they execute before other conditions are completed.
Filters are useful if you only want a disappear certain child records. You can use this with other data tables in the report so even though the data tables reference the same child records, each data table only shows certain child records.
You can use multiple ticket item data tables on a report, each filtered by a different record type such as equipment or labor.
-
Click
 .
.
-
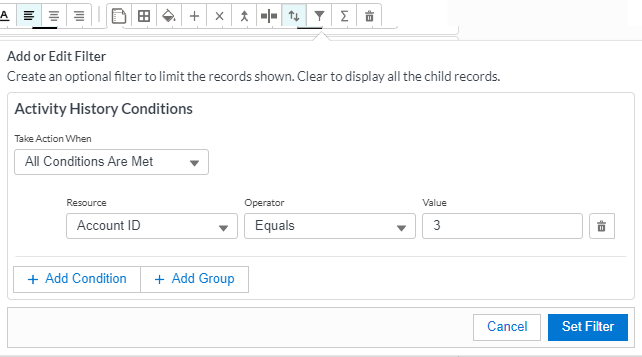
At the Add or Edit Filter window,
-
To define when the filter acts on the table, set the Take Action When dropdown and choose from these options:
Table 1. Data Table Filter Options Option Description All Conditions Are Met
Select this choice if you want the filter to return all results matching all the conditions. This choice uses the AND operator.
Any Condition Is Met
Select this choice if you want any of the conditions. This option uses the OR logic operator.
Custom Logic Is Met
Select this choice if you have multiple conditions in the filter. Each condition has a number. In the Custom Logic field, enter the logic.
For example, if you had three conditions, but you wanted the filter to return results matching condition 1 and condition or just condition 3, you would enter1 AND 2 OR 3Always
(No Criteria)Use this choice to remove all the conditions in the filter to start over. You can’t enter any conditions here.
Formula Evaluates to True
Use this choice if the entered formula is true.
-
Select the Resource from the dropdown.
-
Select a logic Operator from the dropdown.
You must choose a Resource before you can choose an operator. -
Enter a Value.
-
To remove the condition, click
 .
.
-
-
To add another condition to the filter,
A filter can have multiple conditions.
-
Click + Add Condition.
Another row appears below the first condition. You can only use the AND Boolean logic operator.
-
Set the condition specifics the same way as for the first condition.
-
-
To add a group to the filter,
Use Groups if you want conditions to execute together. A filter can have multiple groups of different conditions.
-
Click + Add Group
A new block for the new group appears where you can set conditions.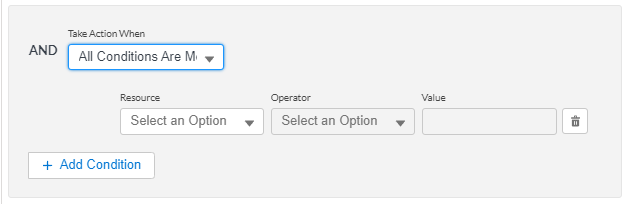
-
Set the condition in the second group by repeating the above step.
-
To add another condition in the second group, follow the steps in step 4.
-
-
To save the filter, click Set Filter.
The report template editor filters the data table.
Use Advanced Filtering
You can set up advanced filters for the template. Clear the filter to show all the child records. For the filter to work, there should be more than one SObject in the data table.
| In DataGuide Forms, Text in an SObject text field is not retained. This means if you use that text field in a filter with a certain text, the filter will not find that text. The filter returns an error message. |
| Adding multiple conditions, multiple groups, and multiple conditions in a filter group within a filter could affect report template performance. |
-
Click the Advanced Filtering tab.
-
Define the first field by clicking in the box marked 1.. You can use the search icon to search for a field.
-
Select the object type and then the record type.
The options in the dropdown menu may be different depending on the object chosen. -
Select the Operator for the filter.
Operator Purpose is null
Shows results that has
is blank
Shows results where the Field is blank.
is not blank
Shows results where the Field isn’t blank.
is not null
Shows results that only has numbers in the Field.
contains
The results only contain what is in the Value column.
Select the object type and then select the sub object (which is based on the chosen object).
doesn’t contain
The results ignore what is in the Value column.
Select the object type and then select the sub object (which is based on the chosen object).
starts with
Shows results from the Value column.
Select the object type and then select the sub object (which is based on the chosen object).
-
Enter the Value for the filter.
You can’t use this field with all operators. Depending on the value in Field, the Value could be a choice of an object and sub-object.
-
Repeat these steps to add more conditions.
-
In Filter Logic, define the order of the conditions.
If there is only one filter condition, that number appears in Filter Logic.
-
-
To finish, click Save.
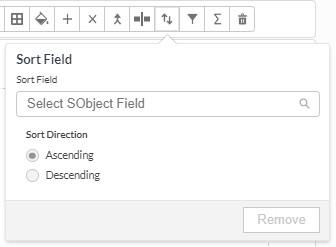
Sort a Data Table
You can sort a data table by one of the SObject Fields in the data table. For the sort to work, there should be more than one SObject in the data table.
-
Click the Sort Field icon.
-
At the Sort Field window,
-
Click in the Sort Field and select the SObject field you want to sort by.
-
Set the sort direction by Ascending or Descending.
-
-
Click off the sort field to apply the sort.
Use a Summary Row in a Data Table
-
Click into a row for a Data Table.
-
Click the Summary Row icon in the data table formatting bar.

A new row appears at the end of the Data Table with a SUM reference field pill. -
Click the icon again to remove the summary row.
-
Click Delete to confirm the deletion.
Add and Configure a Layout Table
-
Drag the Layout Table element to either the Header, Body, or Footer area of the Report Canvas.
A blank 3 column by 3 row table appears on the Report Canvas.
-
Use the
 to drag the Layout Table to the desired position on the canvas.
 -
Use the table layout toolbar to format the table.
When you click off the table to another part in the Report Canvas, the table formatting bar disappears. Click into the table to enable it.
Add a DataGuide Form
For more information,
-
For more information, see DataGuide Forms for Admins.
| You must have the ServiceMax DataGuide package installed, configured for your org and at least one DataGuide Form created. You also must have the proper permissions. |
-
Drag the DataGuide Form element to the Report Canvas.
-
Select a DataGuide form from the list that appears.
The forms that appear will be based on the base object of the report template you are currently working on.
If you have multiple forms, you can use Search to find the form. The list of forms automatically filters based on what you type.
-
Select the form and click Save.
A block for the form appears on the Report Canvas. You can click the
 to switch forms.
Add and Configure the Signature Block
-
Drag the Signature element to the Report Canvas.

You can drag a signature block inside a Layout Table cell. The header or footer can’t contain a signature block, only in the body of the template. -
At the Edit Signature window, complete the items in the Signature Block Options and click Save:
The configured signature block appears on the report canvas:
-
To further edit the signature, click
. -
To remove the signature block, click
 .
.
Insert References
You can insert a Metadata field anywhere in the Report Canvas. When the focus is on the field, the text toolbar can’t be used except for the insert button.
The insert menu places a field indictor, or "pill," into the cursor location.
-
To insert a field, click
 .
. -
Use the dropdown menus and select the type of field.
You can choose from a menu and submenu of field types:
Type
Option
Field
Base Object
(Fields shown are for the Ticket or Invoice object)A list of SObject fields depending on if you had specified an Invoice or Ticket type of template.
Invoice SObjects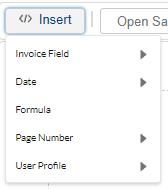 Ticket SObjects
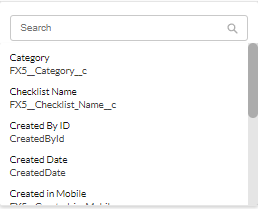
Date
-
Date
-
Time
-
Date and Time
Use these fields to insert the current system date, current system time, or both.
Page Number
-
Current Page
-
Page N of NN
Use this field to insert the current page of the report in either the header or footer.
Or if there are multiple pages, the NN is the total number of pages.
User Profile
-
First Name
-
Last Name
-
Department
Use these fields to pull the first name, last name, or the department name.
-
-
Use the move bar to drag the field to another location on the Report Canvas, within a text block or a cell in a layout table.

-
To see specifics on the pill, hover your mouse over the field pill.
You’ll see the name of the field, its API Name, and the current precision value (ex. 0.00) if the field uses numerical values.
Finish the Template
-
After you have added and configured the elements for your template, click Save.
-
To return to the list of templates, click < Templates.