Admin Tool - Document Template Editor
Introduction
With the Document Template Editor, you create or modify XML templates that can be used in FieldFX Mobile. These Document Templates can used to generate PDF reports, a type of FX Report. You can attach the reports to records as PDFs, which are easier to print and email.
The Document Template Editor is used in FieldFX Back Office as a WYSIWYG (What You See Is What You Get) editor. You can use repeating headers/footers, pagination, and many other advanced formatting options. You can drag design elements to the design canvas and build your report.
For recent updates, see the Document Template Editor Admin Tool Release Notes.
Features
The Document Template Editor has these features:
-
Stricter enforcement of XML Syntax for greater predictability of report rendering success
-
Viewing reports that contain ServiceMax DataGuide Form elements
ServiceMax DataGuide must be installed and configured in your org to use the DataGuide Form elements
Prerequisites
To use the Document Template Editor,
| Have these user licenses | Have these permissions | Before continuing complete these tasks |
|---|---|---|
|
Grant Access to Admin Tools
| As an admin, only give access to users using Permission Sets. The user must have a Salesforce Platform license. |
-
From Setup, enter
Permission Setsin the Quick Find box, then select Permission Sets. -
Click the link for the Permission Set Label you need to modify.
-
To access the Admin Tools dashboard, grant the
AdminTool_Portalpermission.
-
-
Scroll to the bottom of the page and select System Permissions.
-
Click Edit Properties.
-
Mark the Enabled checkbox for Customer Application.
-
Click Save.
-
Repeat the steps for other permission sets as needed.
-
For Admin Tools, the user needs these permissions just for the areas they will be working on:
To use this Admin Tool… Grant this Permission… Document Template Editor
AdminTool_DocumentTemplateEditor
Conditional Pricing
AdminTool_Conditional_Pricing
DataGuide
(must be installed to appear)AdminTool_DataGuide
FX Logs
AdminTool_FX_Logs
Mobile Field Updates
AdminTool_Mobile_Field_Updates
Mobile Filters
AdminTool_Mobile_Filters
Mobile Help Builder
AdminTool_Mobile_Help_Builder
Mobile Rollups
AdminTool_Mobile_Rollups
Mobile Validations
AdminTool_Mobile_Validations
Price Book Rules
AdminTool_Price_Book_Rules
Record Access Check
AdminTool_Record_Access_Check
Report Templates
AdminTool_Report_Templates
Status Workflow
AdminTool_Status_Workflow
Sync Event Viewer
AdminTool_Sync_Event_Viewer
Sync Profile Wizard
AdminTool_Sync_Profile_Wizard
User Share View
AdminTool_User_Share_View
User Wizard
AdminTool_User_Wizard
Set up Permissions / Apex Classes / VisualForce Pages
To use the Document Template Editor within FieldFX, you need to specify the Custom Permissions, Apex Classes, Visualforce Pages.
| If these already exist in the user profile and you still can’t access the Document Template Editor, contact your System Administrator. |
-
In your org, click
 to access Setup.
 -
Custom Permissions for the profile:
-
At Setup, enter
permissionin the Quick Find search box. -
Click Custom Permissions.
-
Click New.
-
At the New Custom Permission screen, add
FX5.Admin Tool - Document Template Editorif not already added.Label
Admin Tool - Document Template EditorName
AdminTool_DocumentTemplateEditorDescription
Configure Document Template Editor features -
Click Save to finish and return to the list of custom permissions.
-
-
For Apex Classes for the profile:
-
At Setup, enter
Apexin the Quick Find search box. -
Click Profiles.
-
Find the profile you want and open it.
-
Under Apps, scroll down to Apex Class Access and open it.
-
Find and add
FX5.OmnibusRestServicein the list.FX5.OmnibusRestServicemay not be on the first page depending on the profile. Use the page tools to navigate to other pages. -
Click Save to finish and return to the list of APEX classes.
-
-
For Visualforce Page access for the profile:
-
At Setup, enter
profilein the Quick Find search box. -
Click Profiles.
-
Find the profile you want and open it.
-
Under Apps, scroll down to Visualforce Page Access and open it.
-
Find and add
FX5.PDFTemplateEditor.Advanced. -
Click Save to finish and return to the list of Visualforce pages.
-
XML Templates
An XML template is a file containing XML markup that controls the design and content of a report template.
XML templates use:
-
XML elements to define the report’s layout.
-
XML attributes to define the appearance of XML elements.
-
Expressions and report helpers to define the report’s content.
You can create XML templates in a text editor.
|
The Document Template Editor should be handling any changes to the XML. Any manual changing in an XML editor outside of the Document Template Editor, if not done correctly, could present issues and cause the report template to not work properly. If editing the XML is required, be sure that the individual editing has the skills to properly format the XML correctly. |
When creating a template outside of the Document Template Editor, ensure it is uploaded as an XML file. The Document Template Editor doesn’t convert it automatically. In the Template file, the Type field must be set to ReportTemplate. See Add 'ReportTemplate' Value to Type Picklist for a step by step.
You can find the field in Setup → Object Manager → Content Version → Fields & Relationship → Type.
PDF Metadata
-
Add PDF file metadata using a
<info>tag in the Report Template. -
Supported metadata attributes are:
-
title- You can also use this for the PDF filename. -
author- -
subject -
keywords
-
-
Report designers can use Handlebars expressions to add dynamic content to the metadata fields.
-
If added manually (outside of the Document Template Editor using the XML Editor), the
<info>tag must be a direct child of the<template>tag.
PDF Metadata Examples
Use the Job Safety Report as the Report Title Each Time a Report Generates |
In the title field of the Report Template, enter This adds the following to the XML for the report template: xml code
|
Dynamically Use the Customer and a Timestamp for the Report’s Title |
If you create multiple PDF reports, you can add the customer and timestamp to the report title to set them apart. In the title field of the Report Template, enter the following Handlebars expression: The Document Template Editor adds the following to the XML for the report template: The resulting report might display as follows: 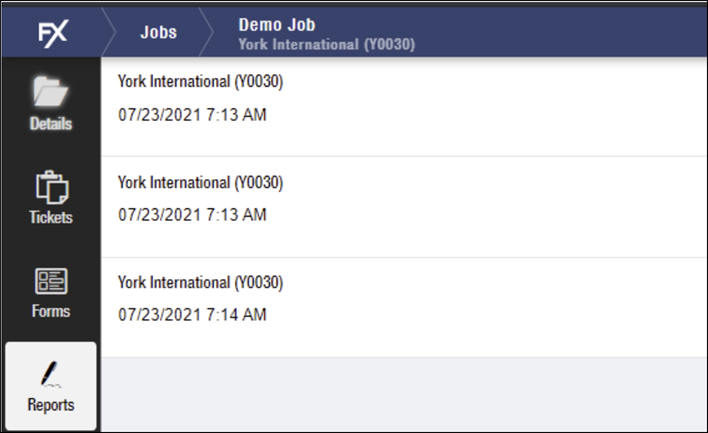
Figure 1. In FX Mobile
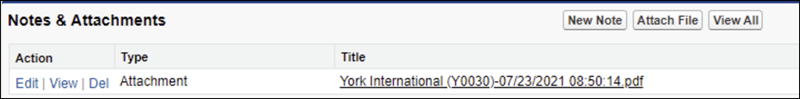
Figure 2. In FieldFX Back Office Notes List also shown in the Files related list (as the name of PDF)
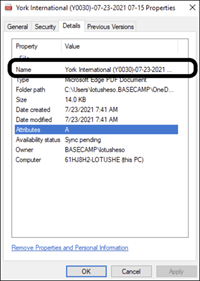
Figure 3. In a Microsoft Windows File Properties displayed by right clicking the file
|
How Report Templates Work
Use the Report Templates Editor tool to add new reports for Quotes, Jobs, Tickets, Invoices and any other object.
|
Use the wizard to create or change an XML template for the report.
Start from a preloaded format or create a new report from a blank template.
|
After creating the report, advanced users can modify the XML directly. |
Document Template Editor Interface
| We fixed an issue where the bold, italic, and underline formatting for a Report PDF wasn’t working. Those formatting controls now work when the report is made into PDF and rendered. |
You can use the document template editor in FieldFX Admin Tools and, if installed, in ServiceMax Dataguide.
| If using ServiceMax DataGuide, you must be an admin to use the Document Template Editor. |
FieldFX created the Document Template Editor for a non-technical person to build a document (report) template. No coding is required, just the ability to drag-and-drop elements onto a canvas and configure the necessary parameters for each element.
The editor is a WYSIWYG (What-You-See-Is-What-You-Get) drag and drop interface where you can design a document template based on a FieldFX object.
You can create report templates for any object in FieldFX with a few exceptions. As you create templates for different objects, they appear in the Main Template List section.
In FieldFX, you can set up a custom button to convert a report HTML to a PDF.
For more information, see the Document Template Editor Admin Tool Release Notes.
Main Screen
The main screen of the Editor has options to do the following:
| Callout | Name | Description | ||||||||||
|---|---|---|---|---|---|---|---|---|---|---|---|---|
1 |
FX |
Click this button to return to the main Admin Tools list. |
||||||||||
2 |
Import |
Click this button to bring in the XML code for another report template created outside of the Advanced Report Template Editor. See Import XML of a Template. |
||||||||||
3 |
+ New Template |
Click this button to create a new report template. You can link this template to any FieldFX object. The editor opens up a new canvas and the Report Canvas appear. |
||||||||||
More |
Click this menu to see:
|
|||||||||||
5 |
The categories shown depend on the FieldFX object that used as a basis for the template. If this is a new org, no report templates exist and the list is blank. |
|||||||||||
6 |
Author Filter |
Use this dropdown to filter the list of templates by the user who created them. |
||||||||||
7 |
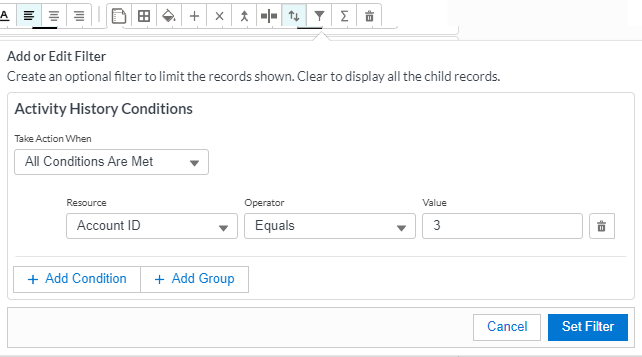
Filter |
Use this dropdown to narrow the report templates that have an advanced filter. Filters can have multiple criteria which can take into account any of the fields available on the report template object. |
||||||||||
8 |
Action icons |
Each report template entry has icons to perform tasks on that template.
|
||||||||||
9 |
Template List |
The created templates appears in a table with these columns:
|


Design Interface
Once you create a new template, a blank Template Canvas appears.
| Callout | Name | Description | ||||||||||||||
|---|---|---|---|---|---|---|---|---|---|---|---|---|---|---|---|---|
1 |
FX |
Click the FX logo to return to the FieldFX Admin Portal. |
||||||||||||||
2 |
Template Functions |
Use this menu to complete common template tasks such as:
|
||||||||||||||
3 |
More |
See More menu option |
||||||||||||||
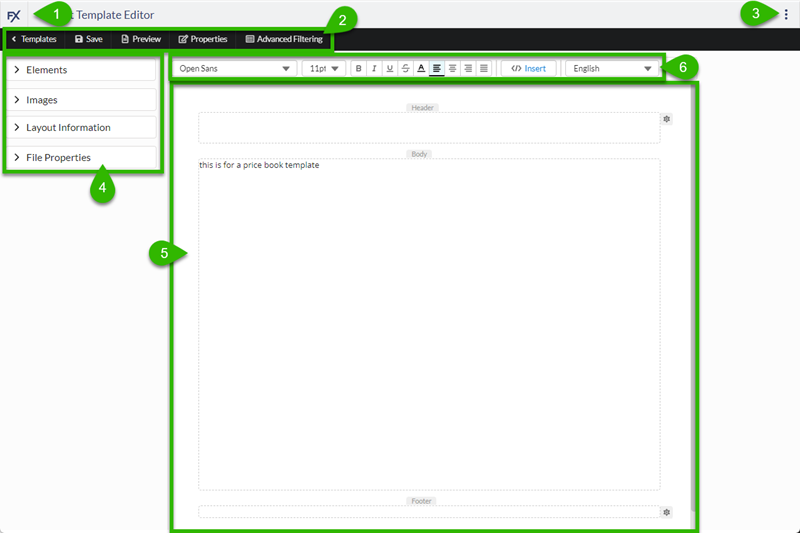
4 |
The editor has collapsible options to add different elements to the template. You can collapse these panels by clicking the > icon.
|
|||||||||||||||
5 |
To start designing a report, begin the Create New Template process and use the Report Canvas to drag and drop elements. You can drag multiple elements, but not all, into the header, footer, and body. |
|||||||||||||||
6 |
This bar stays open at the top of the canvas. When using a text element, you can change the format and font size, plus apply Bold, Italic, Underline, Strikethrough, font color and alignment. See Text Formatting Bar for more information. You can also use the </> Insert button to insert a data field value (dependent on the report object). The field value context depends on:
You can also add a language to the report generation by using the dropdown and selecting + Add language. |
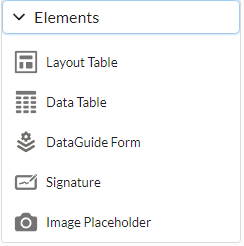
Elements
|
To help build your report, you can type a text, drag a layout table or a Repeating Section, data table, a signature, or a image placeholder onto the report canvas. If you have the ServiceMax DataGuide package installed, there is an additional element available: DataGuide Form. |
Text
You can click anywhere in the report canvas and start typing to:
-
In the header for the company address
-
In the body for a section title
-
In the footer for a confidentiality statement
You can add different text blocks or blank lines within a text block.
-
To add a different text block, press Shift + Enter.
-
To add a new line to the current text block, press Enter.
See Add Text.

You can add text to the Header, Body, and Footer.
Back to Elements
Layout Table
Use this element to insert a blank row table onto the canvas. By default, the table has 3 columns by 3 rows. You can add or remove rows and columns if needed and arrange different elements side by side. You can use layout tables to improve the readability of the template. By using this layout trick, the different elements are arranged side by side and won’t be displayed below each other down the page. Another benefit could be a reduced page count if you print the template.
-
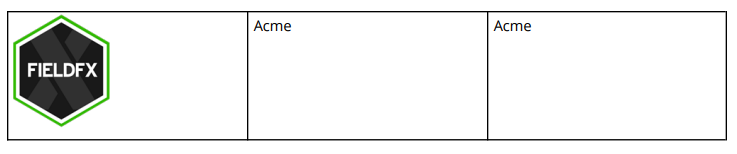
You can configure a report header with logo, report title, and account number in a 3 column, 1 row layout table
In the Report Template Editor Preview of Report 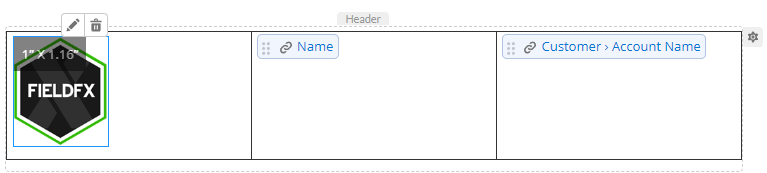
-
Or to have the tech name and signature name next to each other, use a 2 column, 1 row layout table
| You can’t place a table in a cell of another table. |
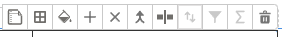
Use the table format toolbar (it appears above the table) to customize the table. Most of these icons are available to customize the Data Table, while others can’t be used.
| Clicking outside the table to another area on the Report Canvas hides the toolbar. |
| Icon | Function |
|---|---|
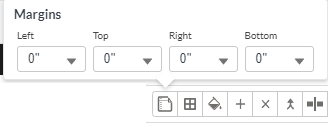
|
Click to adjust the cell margins. Enter the value for Left, Top, Right, or Bottom. |
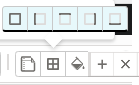
|
Click the sub icon to turn off the border for the selected cell. |
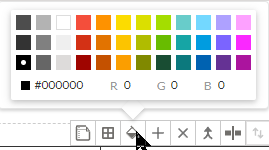
|
Use to change the background of the selected cells. To change the cell color either:
|
|
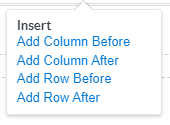
In Layout Tables and depending on the location of the cursor, you can add a column before or after and also add a row before or after.
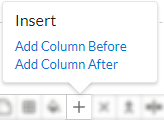
In Data Tables and depending on the location of the cursor, you can insert a column before or after the cursor location. You can only add a Summary row to a data table using the Summary Row function. |
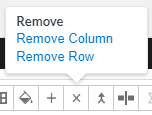
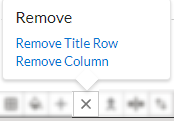
|
Click to remove the selected row, or column, depending on the cursor’s location.
|
|
Click to merge the selected cells into one cell In a Data table, this is disabled. |
|
Click to split the selected cell into two cells. In a Data table, this is disabled. |
|
Click to remove the table. |


You can use the layout table in either the Header, Body, and Footer.
Back to Elements
Repeating Sections
This element allows you to add child objects and set the following:
-
Add a child relationship to the parent object
-
Add related fields
-
Add a layout table in the section and customize/format the table
-
Add images, signatures, and an additional or more repeating section.
See Configuring Repeating Sections for more information.
To add a repeating section, see Add and configure a Repeating Section .
Data Table
Use this element to add a Data Table to the report. A Data Table displays the child records in the current report’s root object.
You can use data tables to show:
You can use Data Tables to show child record collections for:
-
Ticket Items for a Ticket Report
-
Tickets or Ticket Items on a Job Report
You can add multiple data tables can be added.
To configure the table, see Add and Configure a Data Table.
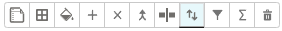
The formatting toolbar is similar to that for the Layout Table but has more functions.
| Icon | Function |
|---|---|
|
Click to adjust the cell margins. Enter the value for Left, Top, Right, or Bottom. |
|
Click the sub icon to turn off the border for the selected cell. |
|
Use to change the background of the selected cells. To change the cell color either:
|
|
Depending on the location of the cursor, you can insert a column before or after the cursor location.
|
|
Click to remove the title or selected row, depending on what you have selected.
|
|
Click to merge the selected cells into one cell |
|
Click to split the selected cell into two cells. |
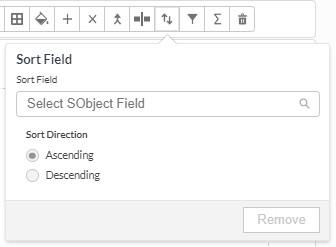
|
Click to sort the data table by an SObject Field and select the order as Ascending or Descending.
|
|
|
|
Use this icon to insert a Summary Row in a Data Table. A new row appears at the end of the Data Table with a Sum reference field pill. The Summary Row stays selected if there is a summary row in the data table. When creating a summary, you must choose the field to summarize. The summary function doesn’t automatically assume that you are trying to summarize the field above. |
|
Confirmation to remove the table. |


This Data Table menu only appears at the top of the Data Table when your cursor is in the Data Table. If you have another Data Table in the report, and move the cursor to it, the Data Table menu appears above it.
Back to Elements
DataGuide Form
Drag this element to the report canvas to insert a DataGuide Form into the report.
For more information, see ServiceMax Documentation: DataGuide Forms.
| You must have the ServiceMax DataGuide package installed and at least one DataGuide Form created. |
To use the DataGuide Form element, see Add a DataGuide Form.
Signature
Drag this element to the report canvas to insert a signature block in the report.
To edit the block, click the gear icon. You can:
-
Set a caption (required)
-
Enter watermark text which appears behind the signature line. The watermark can also be a date, formula, or a Salesforce field reference.
Table 5. Signature Block options Caption
Enter the caption that appears underneath the signature line.
Watermark
Choose the type of watermark you want:
Text
Enter the text that appears in the signature line.
Date
Displays the report’s creation date.
Formula
Enter the name of the SObject field you want to appear here. Usually you can use this to show the job number, ticket number, or invoice number.
Salesforce Field
Select the standard Salesforce SObject.
Select Size: Width, Height
Enter the width and height in inches of the signature block.
-
Change the size by entering a width and height in inches
-
Remove the signature block from the report canvas
At the Remove Signature confirmation, click Yes to confirm the removal.
See Add and Configure the Signature Block to configure the signature block.
You can add more than one signature element to the report canvas.
You can also add a signature block to the Header, Body, or Footer.
Back to Design Interface
Image Placeholder
Drag this element to add an image to the report canvas. You can reposition the image placeholder within the report canvas.
Use it for capturing an image and appending it to the report when the report is generated in Mobile or Back Office.
|
The Document Template Editor supports these image formats:
|
| Only a single image can be added in an image placeholder. |
Back to Design Interface
Images
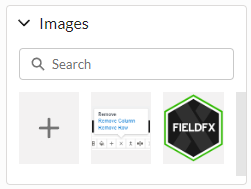
|
This panel shows the graphics already uploaded where you can use it. There is a search field where you can search for an image if you have multiple images. |
See Add an Image.
A suggested use could be including Logo or watermark on the report template.
| You can only use images that you’ve already added to the Editor. The Editor automatically scales the images to fit if they are larger than the page size. Images must be static, no animated GIFS. |
|
The Document Template Editor supports these image formats:
|
You can use the search field of available images to find images you can add to the report canvas. You can see a list of the recently added images for quick access.
If you double-click on the image, you can resize it by dragging the handles at the corners or use the window that appears and entering the width and height size in inches.
You can add images to the Header, Body, and Footer.
Back to Design Interface
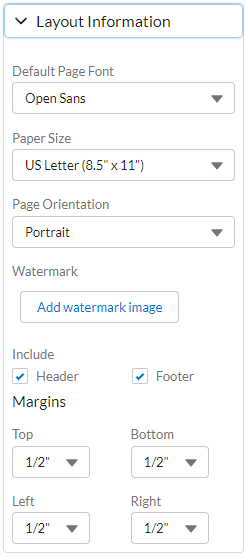
Layout Information
You can select the page dimensions by common paper size types. Choose between portrait or landscape orientation. You can also specify the page margins on the left, right, top, and bottom by using drop down menus.
You can collapse the Layout Properties panel by clicking the > icon.
|
|
Back to Design Interface
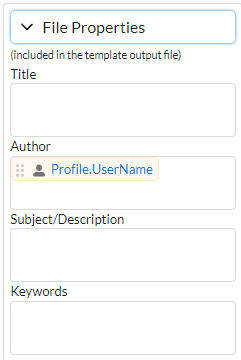
File Properties
You can set the report title, author, subject and add keywords to help classify and search for the report.
|
|
Back to Design Interface
Report Canvas
The canvas has three areas: header, body, and footer.
| Section | Options | ||
|---|---|---|---|
Header |
To edit the header, see Set the Header and Footer Properties.
|
||
Body |
The body section automatically fills space between the header and footer, taking in account the spacing set in the header and footer properties. |
||
Footer |
To edit the footer, see Set the Header and Footer Properties.
|
Text Formatting Bar
Along the top of the report canvas is the common rich text editing toolbar. You can set the font, font size, and apply text formatting such as bold, italics, underline, and strikethrough. You can also set the alignment of the text element to left justified, center justified, or right justified.
View FX Reports Attached to Records
FieldFX Back Office
-
Open the record.
-
Locate the report in the attachments list.
The Attachments feature in FieldFX has been deprecated and replaced with the Files API. To upload files to tickets or jobs, make sure the FXL File Viewer Lightning Components is added to the ticket or job record page.
Follow the steps in Set Up Attachments Using the Files API.
-
Click View.
-
Continue with setting the ReportAsFiles checkbox.
Set the ReportAsFiles App Setting Active Checkbox to Active
-
From Setup, enter
Custom Metadatain the Quick Find box. -
Select Custom Metadata Types.
-
In the AppSetting row, click Manage Records.
-
In the AppSetting section, click Edit in the ReportAsFiles row.
-
In AppSetting (Managed), click Edit.
Only certain attributes can be edited. Since it is managed, you can only edit the Protected Component, Active, and Value fields. All other fields locked. -
In AppSetting Edit,
-
Click Edit.
-
Select the Active checkbox.
If the Active checkbox isn’t present, you will have to edit the layout and add it. You only have to do this once. -
In AppSetting (Managed), click Edit Layout.
-
Find the Active button.
-
Click and drag it down to the AppSetting Sample section to just above the Value field.
Active with a checkmark appears.
-
Click Save.
-
For the Value, select True.
-
-
-
Click Save.
FieldFX Mobile
Click to expand - FieldFX Mobile App
-
Tap + Add.
-
At the Select a Report Template, select a listed template.
-
Depending on the chosen template, a new report record is created and the report preview window appears.
-
Tap the report to open a preview.
-
Tap the X to close the preview and see the list of reports again.
Click to expand - FX Mobile
-
Open the record.
-
Select Reports on the sidebar.
-
Select the Show Existing Reports button.
 Figure 5. Tap the blue circle with the white bullet list so show existing reports
 -
Select the report.
Considerations
Existing reports continue to work as designed, but you can’t edit them with the wizard tool.
You can edit the code for existing HTML report templates and XML report templates with the built-in code editor.
You can create new reports as XML templates.
|
HTML reports have been deprecated and will not receive enhancements or new features. |
Best Practices
Be aware of the objects used for the report. Consider creating a diagram or writing down the objects and their relationships.
If defining the XML manually, you can use margins for increased readability and accessibility of the report. Keep spaces at the edges of the report and between sections.
|
Margins are always set clockwise: Left, Top, Right, Bottom. |
Consider the content of the report data and whether the width of a landscape orientation is better than the height of a portrait orientation.
If there is any chance of ever printing the report, always print an example.
Troubleshooting
To display forms in the browser, you must disable the Google Chrome setting whether the browser displays or downloads PDF files.
| Google Chrome is a 3rd party application, and the instructions for how to disable this option may change at any time without warning. |
-
In Google Chrome, go to
chrome://settings/content/pdfDocuments.(Enter that path directly in the browser’s address bar.)
-
Verify the toggle for Download PDF files instead of automatically opening them in Chrome is disabled.
Or:
-
Access Google Chrome’s settings.
There are multiple ways to do this, but one is to select the vertical dot Customize and Control button in the top right corner of the browser, then select Settings. -
Select Privacy and security in the left navigation bar.
-
Select Site Settings.
-
Select PDF documents.
You may need to expand the Additional content settings group of options first. -
Verify the toggle for Download PDF files instead of automatically opening them in Chrome is disabled.
Recommended Reading
-
Advanced users can take advantage of the Handlebars template library.