FX Logs
Prerequisites
To use FX Logs, you need to:
| Have these user licenses | Have these permissions | Complete these tasks and review these topics before continuing |
|---|---|---|
Config FX Logs Custom Permissions
To use FX Logs within FieldFX, you need to specify the custom permissions.
-
In your org, click
 to access Setup.
 -
At Setup, enter
permissionin the Quick Find search box. -
Click Custom Permissions.
-
Find
Admin Tool - FX Logsin the list. -
If not,
-
Click New.
-
At the New Custom Permission screen, add
Admin Tool - FX Logsif not already added.Label
Admin Tool - FX LogsName
AdminTool_FX_LogsDescription
View sync use and data
-
-
Click Save to finish and return to the list of custom permissions.
-
-
Add custom permission to profile.
-
At Setup, enter
Apexin the Quick Find search box. -
Click Profiles.
-
Find the profile you want and open it.
-
In the list of Custom Permissions, find
FX5.Admin Tool - FX Logs. -
Click Edit and ensure that the
FX5.Admin Tool - FX Logscustom permission is checked.
-
-
Apex Classes for the profile.
-
At Setup, enter
Apexin the Quick Find search box. -
Click Profiles.
-
Find the profile you want and open it.
-
Under Apps, scroll down to Apex Class Access and open it.
-
Find
FX5.OmnibusRestServicein the list.FX5.OmnibusRestServicemay not be on the first page depending on the profile. Use the page tools to navigate to other pages.
-
Access FX Logs
Go to https://fxlogs.fieldfx.com and log in as a FieldFX administrator. In Admin Tools, click on FX Logs.
Date Controls
Use the date controls to change the dates and times analyzed in the metrics.
|
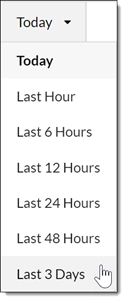
Figure 1. Use the selector to choose how far back to display log data
|
Statistics
With FX Logs, you can monitor the these statistics:
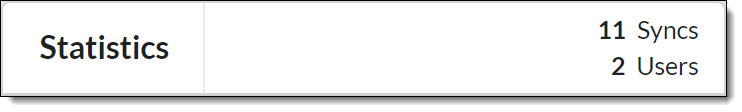
Figure 2. Sync Statistics display total syncs and total number of users
|
||||
Sync success rate. |
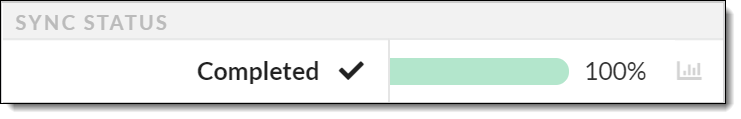
Figure 3. Sync Status displays the percentage of syncs completed
|
|||
Percentage of each type of sync.
|
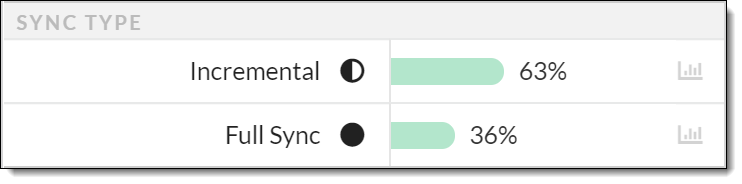
Figure 4. The percentage of syncs of each sync type
|
|||
Percentage of syncs on each version of FieldFX Mobile.
|
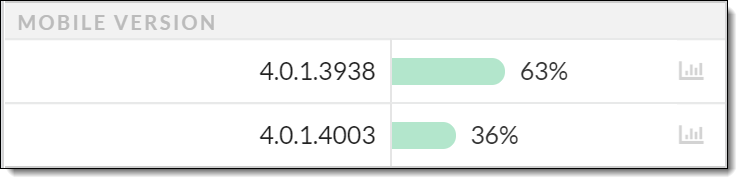
Figure 5. Percentage of syncs from each version of mobile
|
|||
Percentage of syncs in each operating system. |
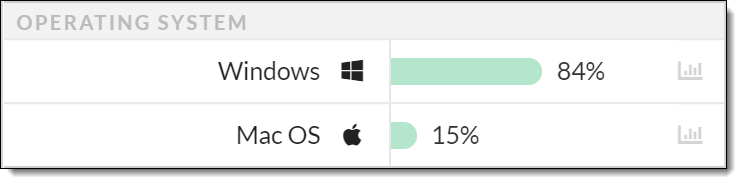
Figure 6. Percentage of syncs originating from various operating system
|
|||
Percentage of syncs in each browser. |
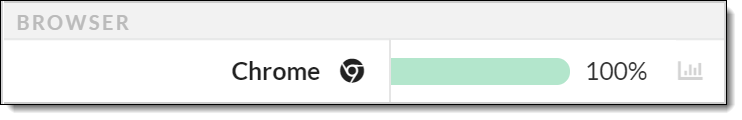
Figure 7. Percentage of syncs from various Internet browsers
|
|||
Percentage of syncs on each type of device. |
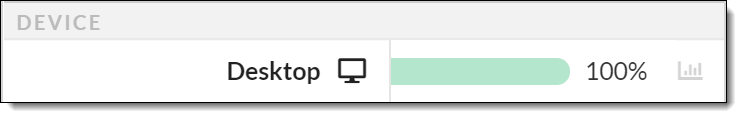
Figure 8. Percentage of syncs from various types of devices
|
Sync History
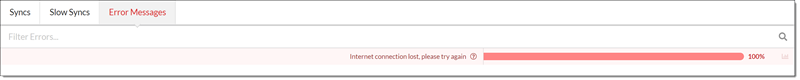
With the Sync History, you can view information on three different tabs: Syncs, Slow Syncs Tab, and Error Messages Tab.
| Tab Name | Description | ||
|---|---|---|---|
Displays details for every sync during the specified range. 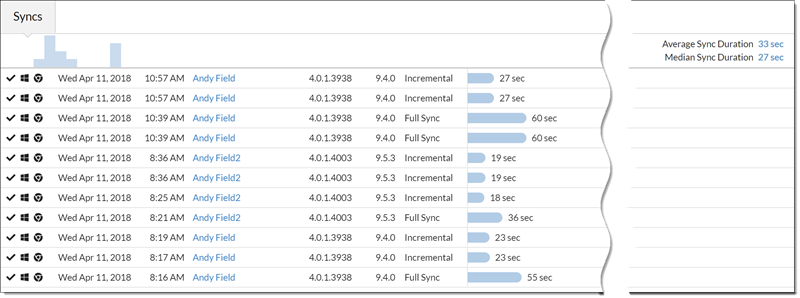
Figure 9. Example of the full Syncs tab
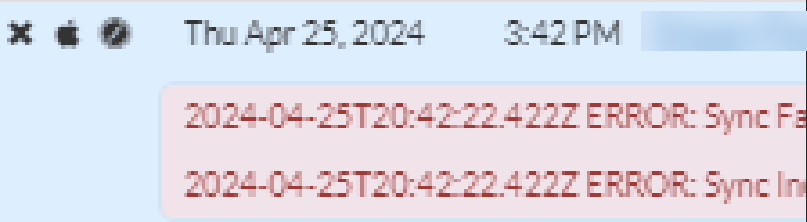
Hover over the icons on the left of each entry to view further details about that sync. 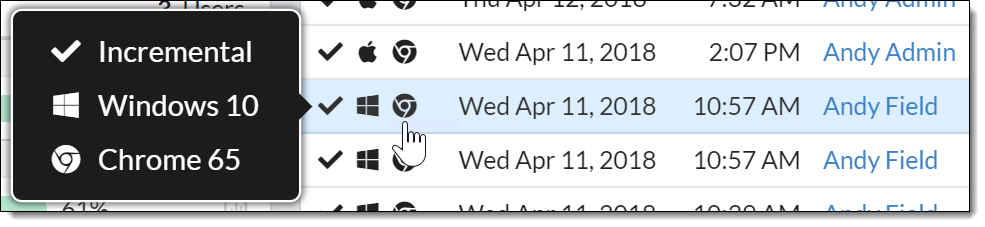
Figure 10. See more information about a sync by hovering over the icons to the left of a particular sync
Select a sync and a panel displays at the bottom of the page to show detailed information. 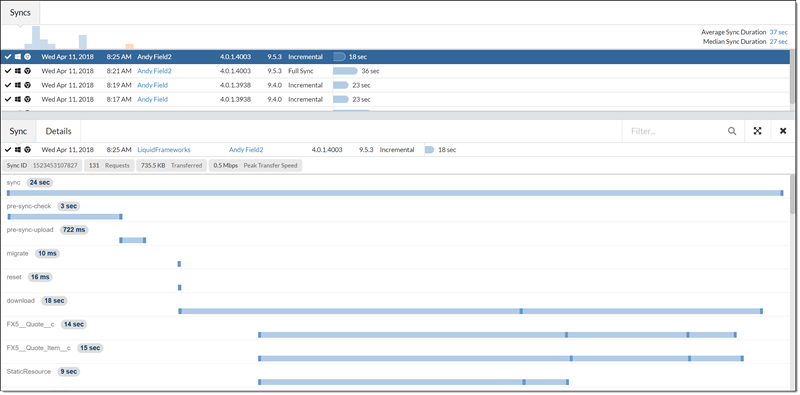
Figure 11. Selecting a sync prompts a details panel to display on the bottom of the screen
|
|||
Displays details for every sync that took longer than 1 minute. 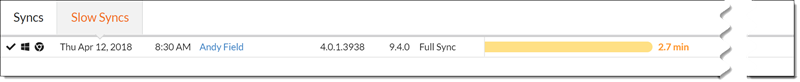
Figure 12. If a sync took longer than one minute, an additional Slow Sync tab displays in the Sync Details panel
Hover over the icons on the left of each entry to view further details about that sync. 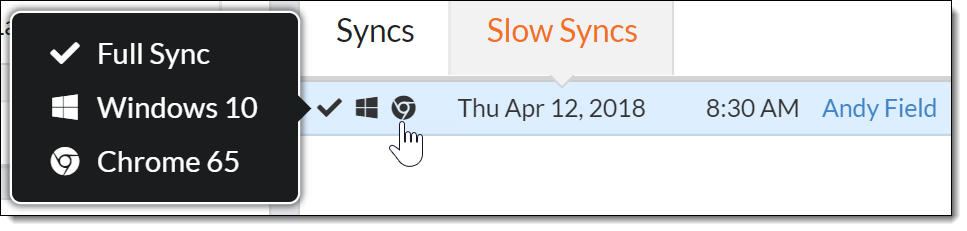
Figure 13. Display more details about a Slow Sync by hovering over the icons
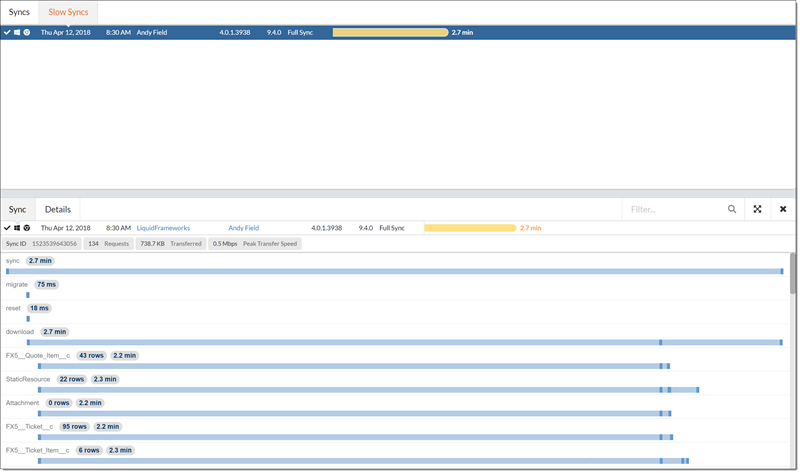
Figure 14. The Slow Syncs tab also displays the Details panel when a particular sync is selected
|
|||
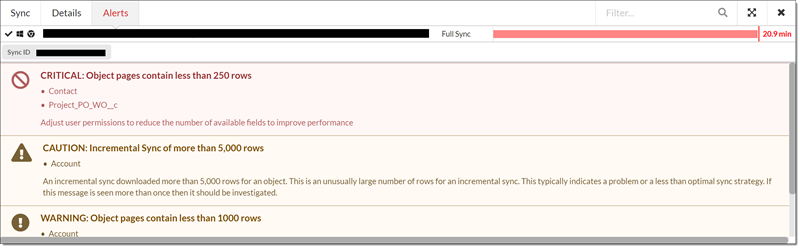
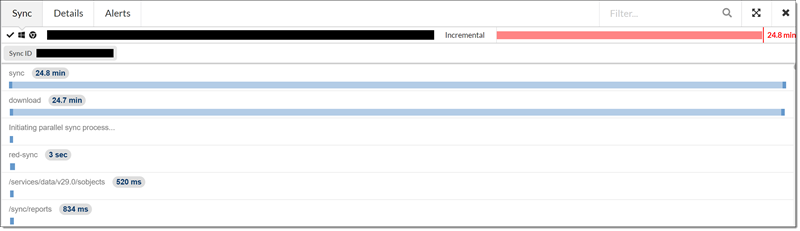
Diagnosing Sync Issues
After selecting a sync, information about the selected sync displays in the bottom portion of the screen in the Sync, Alerts, or the Details Tab.
| Tab Name | Description | ||
|---|---|---|---|
Each sync request displays in the order in which it begins, summarized by the type of information in the request. Example 1. Account object requests
Requests to Account object are summarized on the same row. Each request has a The bar graph which shows the active and inactive sync times. Active times are in darker blue. Inactive times are in lighter blue. |
|||
Displays more information about each active request in the order in which it is active. Example 2. Active Request from the Account object
Each active request for information from the Account object appears on a separate line. Pills give more information about the request. Hover over some pills for more details, such as the query used. |
|||
Alerts give additional details to pay attention to
Summaries of potential problems that could be addressed to improve future sync performance.
Alerts are prioritized in these categories:
|