Sync Health Board
Prerequisites
-
To use the Sync Health Board, you need the following licenses:
-
To use the Sync Health Board, you must:
-
To use the Sync Health Board, you need:
Basics
The Sync Health Board displays real-time metrics about Sync Engine performance.
| If your org has enabled auto sync to automatically upload data from FieldFX Mobile to FieldFX Back Office, use the Sync Event Viewer instead. The auto sync upload feature is currently still in development. |
Use the Sync Health Board to monitor:
-
Average sync duration
-
Number of syncs
-
Sync success rate
-
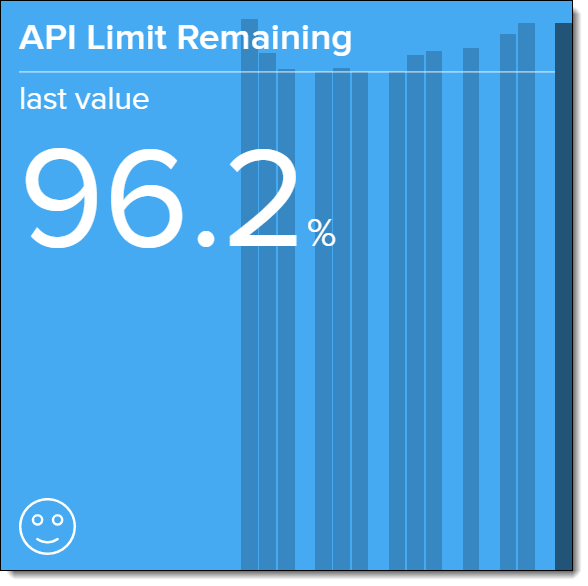
API limit remaining
Getting There
Open the Sync Health Board tab in FieldFX Back Office.
Date Controls
Use the date controls to change the dates/times analyzed in the metrics.

You can view data from the last 5 minutes up to the last four weeks.
Metrics
Sync Overview
Graph showing every successful and failed sync on all release channels in your org.
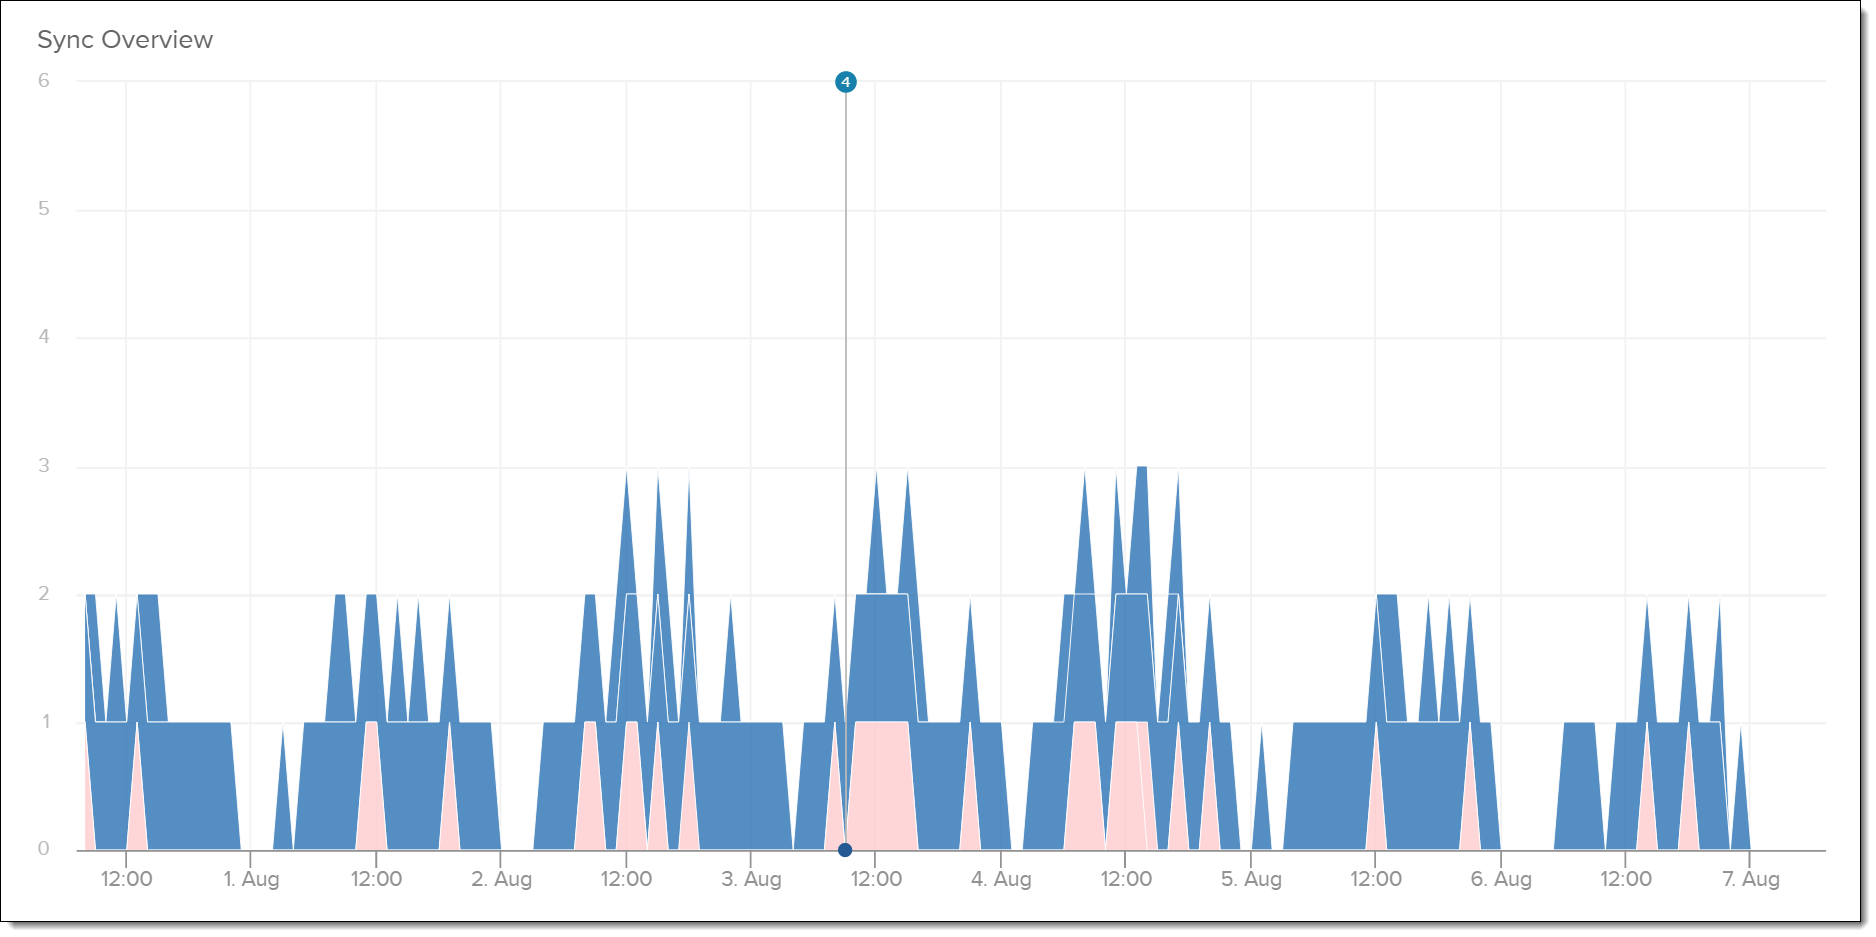
| Move the mouse over spikes on the graph to view specific details. |
Upload Errors
Graph showing every sync upload error on all release channels in your org.
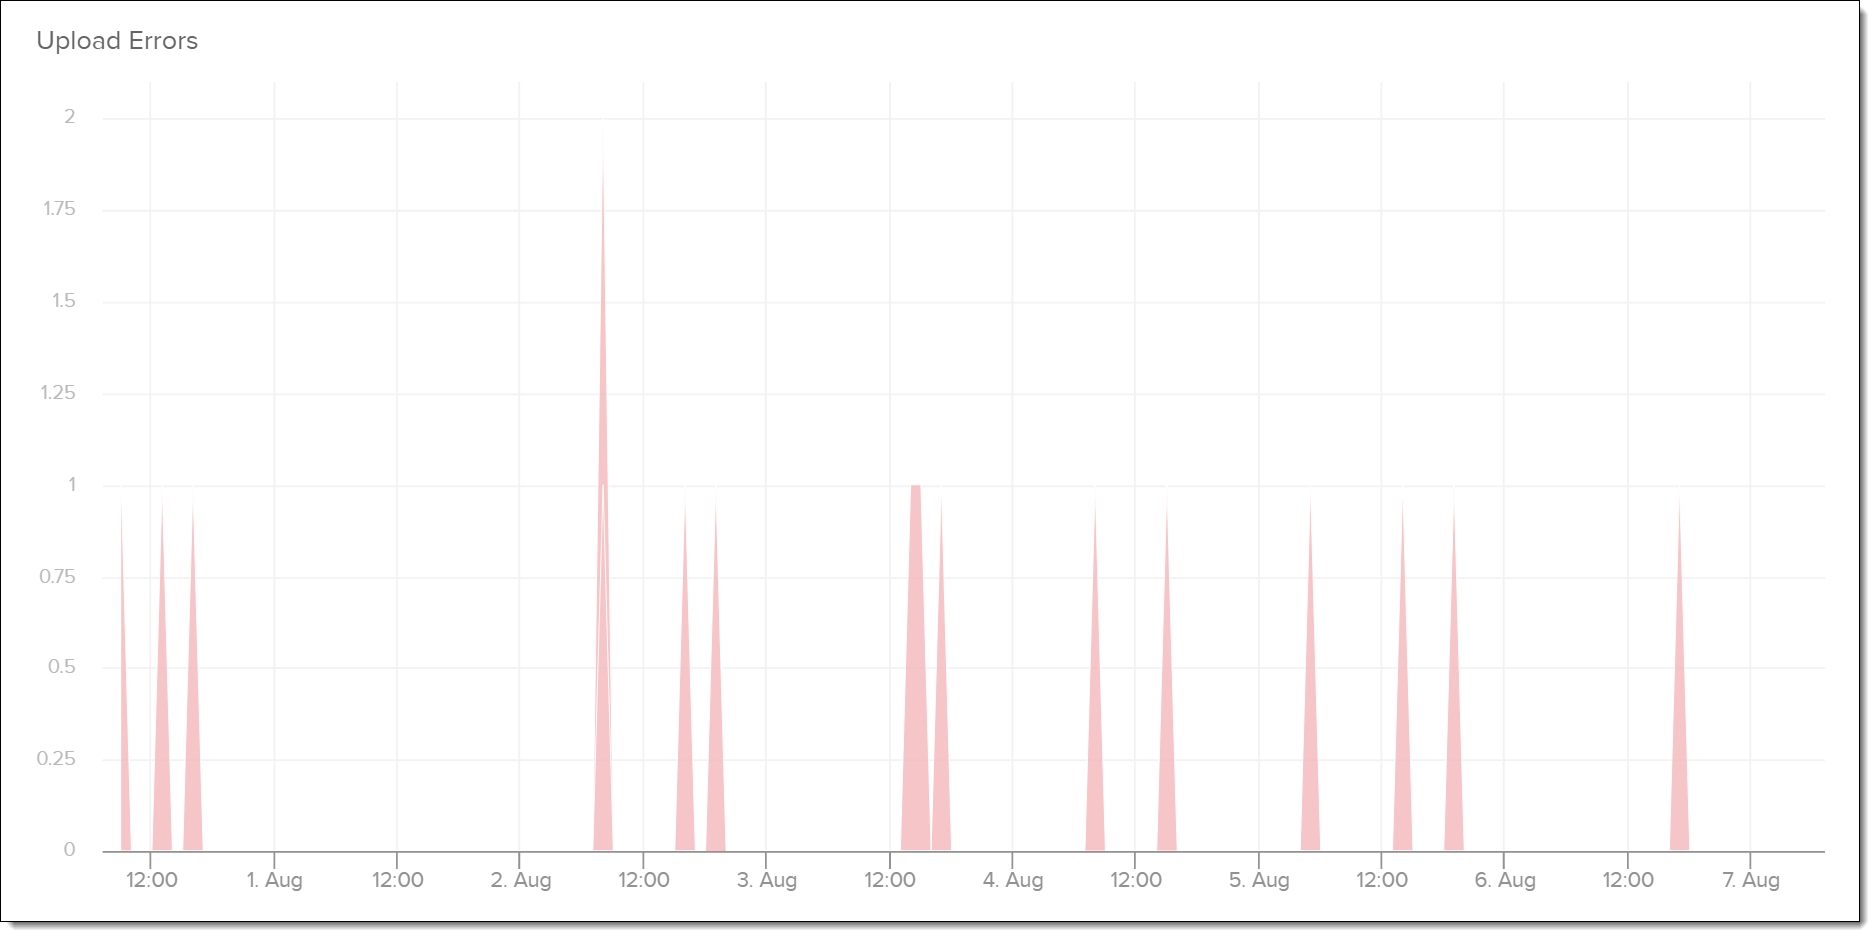
| Move the mouse over spikes on the graph to view specific details. |
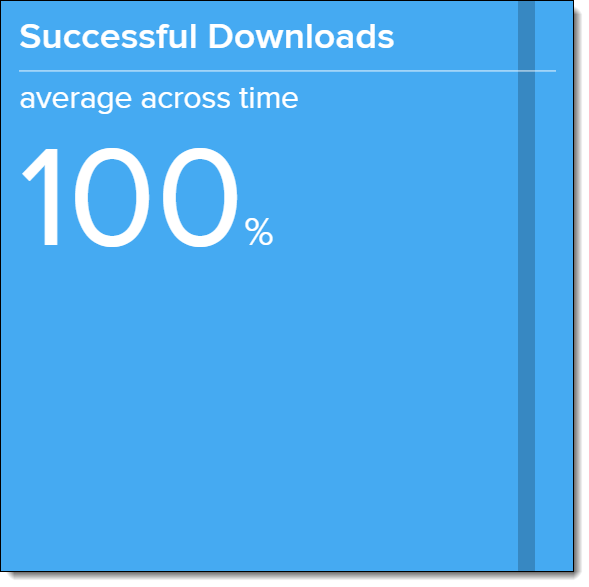
Successful Downloads
Success rate of downloading data to FieldFX Mobile in your org.
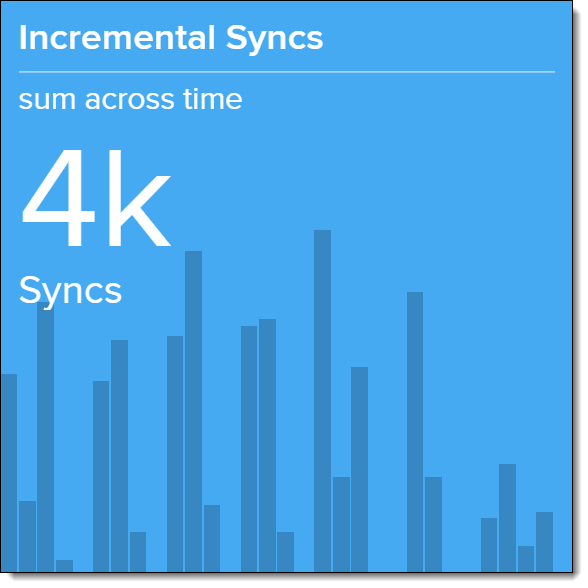
Incremental Syncs
Number of incremental syncs in your org.
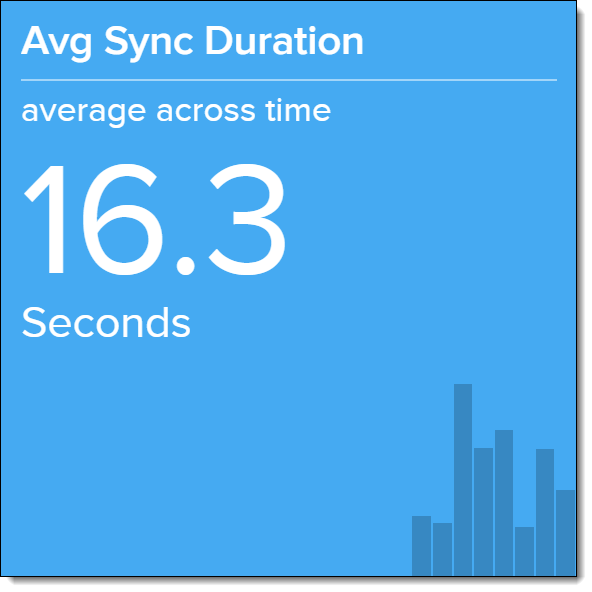
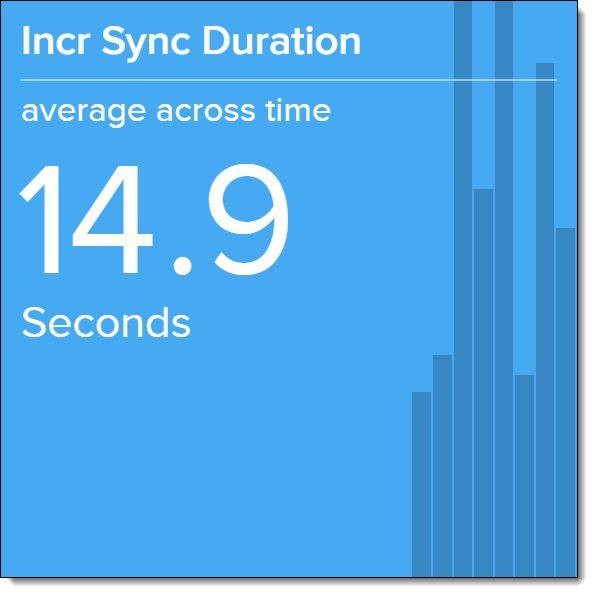
Incr(emental) Sync Duration
Average duration of incremental syncs in your org.
LFW Avg Success
Success rate of syncs across all orgs using FieldFX.
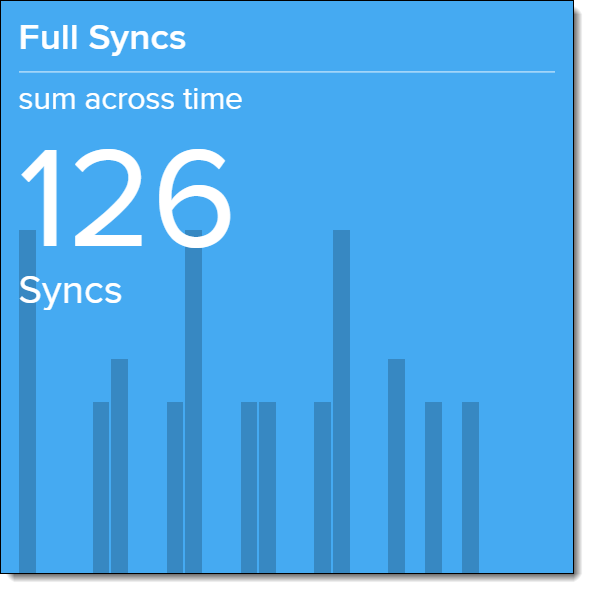
Full Syncs
Number of full syncs in your org.
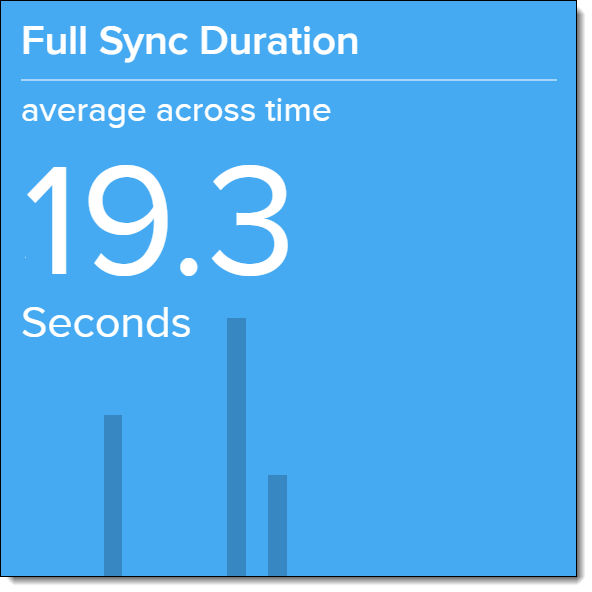
Full Sync Duration
Average duration of full syncs in your org.
Upload Success Rate
Success rate of uploading data to FieldFX Back Office in your org.
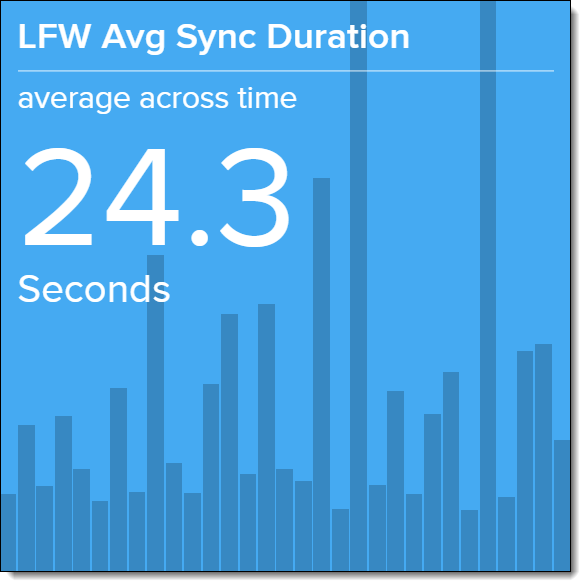
LFW Avg Sync Duration
Average duration of syncs across all orgs using FieldFX.